
Permissions
The InboundIntegrations_GlobalAccess entitlement is required to create, update, and delete inbound email, API, chat, and heartbeat integration templates. Roles with this entitlement: Owner, App Admin, and Integrations Admin.
Overview
Relevant for App Admins and Integrations Admins
AlertOps Heartbeat Monitoring listens for a signal — a heartbeat — from an external source. When the heartbeat is interrupted for a specified period, an alert is sent to a person or team.
- Only one alert is sent per missed heartbeat.
- When pulses resume for an open alert, the alert closes automatically.
- You can create multiple Heartbeat Monitors; each is tracked separately.
- Heartbeat Groups — organize heartbeats by service, region, environment, or customer.
- Grid View — a live dashboard of status cards showing health, pulse history, and check interval for every heartbeat, arranged by group.
- Analytics — per-heartbeat uptime history so you can see exactly when a heartbeat went down and how it has trended over time.
- Integration Name (required)
- Escalation Policy / Response Play (required) — how missed-heartbeat alerts are routed
- Heartbeat Interval (minutes) (required) — your expected ping cadence
- Recipient Group(s), Recipient User(s), Bridge (optional)
- Enabled — checked by default
- Current status — Healthy or Degraded at a glance, color-coded
- Pulse history bar — a visual record of recent checks (green = received, orange = missed)
- Check interval — the expected cadence (e.g., Every 5 mins)
- Last trigger — when the heartbeat last fired an alert
- Daily uptime derived from heartbeat check history, plotted over time
- Health bands — Healthy (99–100%), Degraded (95–99%), Critical (<95%)
- Missed Heartbeat Dates — every day the heartbeat missed pings, listed below the chart
- Right-click the task in Task Scheduler and click Run.
- Confirm the ping registers in AlertOps (watch the pulse history on the heartbeat’s card).
- Add a log file to the PowerShell script for better diagnostics.
- Trigger the ping only after certain services succeed (e.g., backups, batch jobs).
- For multiple servers or jobs, create separate Heartbeat integrations and organize them with Heartbeat Groups (e.g., a group per site or customer), then watch them all from the Grid View.
Beyond alerting on silence, Heartbeat Monitoring now gives you continuous visibility into every monitor:
Configuring Heartbeat Monitoring
Heartbeat Monitoring lives under Configuration → Integrations, in the Inbound Integrations section.
Add a Heartbeat Integration
On the Inbound Integrations list, open the integration-type drop-down and choose Heartbeat. The list filters to your Heartbeat integrations and the Add button changes to + ADD HEARTBEAT. Click it to open the configuration form.
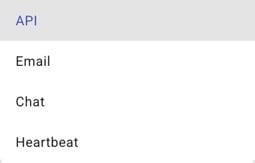
Figure 1. Choose Heartbeat from the inbound integration-type drop-down (API / Email / Chat / Heartbeat).
Configure the Heartbeat Integration
On the configuration form, fill in:

Figure 2. The Add Heartbeat form (Basic Settings).
Click Submit, then open the saved integration. The API URL appears at the top of the detail page next to COPY — this is the endpoint your system pings. For a Heartbeat it looks like https://notify.alertops.com/Heartbeat/…

Figure 3. The saved Heartbeat integration’s detail page with the API URL and COPY button.
How the Timing Works
The Heartbeat Interval is your expected cadence. Each ping that reaches the API URL resets the timer. As long as a ping arrives within every interval, the heartbeat is healthy and nothing happens. If a full interval passes with no ping, AlertOps treats the silence as a problem and opens a single Heartbeat alert, routed through the integration’s Escalation Policy. When pings resume, the open alert closes automatically.
Organizing Heartbeats with Groups
New
As heartbeat counts grow, a flat list stops scaling. Heartbeat Groups let you organize monitors the way you think about your estate — by service, region, environment, or customer.
Create a Group
From the Heartbeat view, choose Add Group and give it a name and description (for example, Low-Level Environments — Non Prod, Staging, and QA environment Heartbeats). Click Submit.
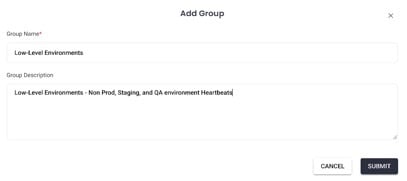
Figure 4. The Add Group modal.
Assign Heartbeats to Groups
From the list view or a grid card, open the group menu on any heartbeat and pick its group. Heartbeats not yet assigned appear under Uncategorized, so nothing gets lost while you organize.

Figure 5. Assigning heartbeats to groups from the list view.
Each row also exposes quick actions: view analytics, move to group, and delete.

Figure 6. Per-heartbeat row actions: analytics, move to group, delete.
Heartbeat Grid View
New
The Grid View turns your heartbeats into a live status dashboard. Heartbeats are arranged in columns by group, and each card shows:
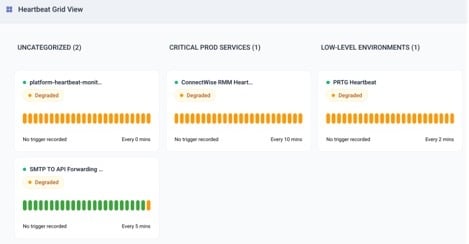
Figure 7. Grid View with heartbeats organized under Uncategorized, Critical PROD Services, and Low-Level Environments.
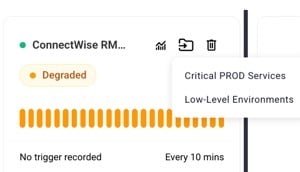
Figure 8. A single card up close — status badge, pulse history, and interval.
Use the Grid View as a wall dashboard for NOC or SRE teams: one glance tells you which services and regions are quiet, which are degraded, and where to look first.
Heartbeat Analytics
New
Every heartbeat now keeps its history. Open a heartbeat’s analytics (chart icon) to see the Uptime Overview:
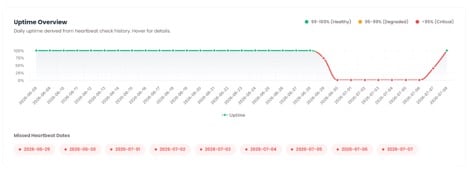
Figure 9. Uptime Overview with health bands and missed heartbeat dates.
This answers the questions a raised alert can’t: How reliable has this job been this quarter? When exactly did it start failing? Is that flaky backup getting worse?
Test the Heartbeat
Using a tool such as Postman, send a POST with a JSON body (an empty {} is fine) to your Heartbeat Integration’s API URL and confirm the integration registers a successful ping — you’ll see it land in the pulse history. Then stop sending and confirm an alert opens once the interval elapses. Exercising both the healthy and missed states gives you confidence before wiring it into a real job.
Receiving Heartbeat Alerts
When a heartbeat is missed, alert notifications are sent according to the configured Escalation Policy — the same notification, escalation, and on-call behavior as any other AlertOps alert.
When to Use a Heartbeat
Reach for a Heartbeat any time the failure you care about is silence — a process that should run on a schedule but might simply not run at all, where no error is ever emitted because nothing fired. Classic fits: nightly backups, cron jobs, scheduled ETL / data pipelines, RMM scripts, batch jobs, and any “dead man’s switch” where no news is bad news. For systems that actively send errors when something breaks, use an API or Email integration instead; use a Heartbeat to catch the cases where the system goes quiet.
Use Case — Windows Scheduler + PowerShell
Relevant for anyone setting up a Windows-based heartbeat sender
Example scenario: ping your AlertOps Heartbeat URL every 5 minutes from a Windows machine using Task Scheduler.
1. Create the Heartbeat Integration in AlertOps
- Go to Configuration → Integrations and select Heartbeat from the integration drop-down.
- Click Add Heartbeat.
- Name your Heartbeat (for example, “Windows Server Health Check”).
- Associate it with an Escalation Policy and a Group / User.
- Set the heartbeat interval (e.g., 5 minutes).
- Copy the heartbeat URL — it looks like https://notify.alertops.com/Heartbeat/…
2. Create a PowerShell Script to Send the Ping
Create a file called Send-Heartbeat.ps1:
# Send-Heartbeat.ps1
$heartbeatUrl = "" # Replace with your actual Heartbeat URL
try {
$headers = @{ "Content-Type" = "application/json" }
# Optional body — empty JSON object is fine
$body = @{} | ConvertTo-Json
$response = Invoke-RestMethod -Uri $heartbeatUrl -Method Post -Headers $headers -Body $body
Write-Output "Heartbeat POST sent successfully at $(Get-Date)"
} catch {
Write-Error "Failed to send heartbeat POST: $_"
}
You can also use Invoke-WebRequest instead of Invoke-RestMethod.
3. Set Up Windows Task Scheduler
- Open Task Scheduler (search in the Start Menu).
- Click Create Basic Task on the right panel.
- Name it (e.g., “AlertOps Heartbeat Ping”).
- Choose Daily, then click Next.
- Set the Start time, then click Next.
- Select Repeat task every 5 minutes for a duration of 1 day. To set this, tick “Open the Properties dialog for this task when I click Finish.”
- Choose Start a Program, then click Next.
- Program/script: powershell.exe
- Add arguments: -ExecutionPolicy Bypass -File "C:\Path\To\Send-Heartbeat.ps1"
- Click Finish. In Properties → Triggers → Edit → set Repeat task every 5 minutes for a duration of Indefinitely.
4. Test It
Optional Enhancements
Other Example Use Cases
1. Job Completion Check
A scheduled backup job, ETL pipeline, or report generation task runs every night. After success, it sends a heartbeat. If none is received, AlertOps assumes the job failed or never ran and triggers an alert. Works well for SQL Server Agent jobs, cron jobs, RMM scripts, and Power Automate flows. Use Analytics to review each job’s uptime history and spot chronically flaky jobs.
2. Batch Job or Data Pipeline Hand-off
A data warehouse ETL system (e.g., Airflow, Informatica, SSIS) runs multiple jobs. The heartbeat is sent only after all stages complete. AlertOps detects missed steps even if no failure is reported in the pipeline UI.
3. Service and Region Rollups
Create a group per service tier (e.g., Critical PROD Services, Low-Level Environments) or per region, assign each heartbeat, and use the Grid View as a single pane of glass. On-call responders see instantly which tier or region is affected — and Analytics shows whether an outage was a blip or a pattern.