
PRTG - Overview:
PRTG Network Monitor is an infrastructure monitoring solution that monitors the availability, performance, and health of IT infrastructure, including servers, network devices, applications, and services.
The AlertOps integration connects PRTG with AlertOps, enabling monitoring notifications to be automatically forwarded whenever a monitored sensor experiences a status change. AlertOps processes these notifications to create, update, and resolve incidents, ensuring that the appropriate on-call responders are notified through SMS, voice calls, push notifications, and email using escalation policies and on-call schedules.
Prerequisites
📌 Before You Begin
- An active AlertOps account with Owner, App Admin, or Integrations Admin permissions to create and configure inbound API integrations.
- Access to a PRTG Network Monitor instance with sufficient administrative permissions to create notification templates and configure notification triggers.
- The AlertOps inbound integration endpoint URL, generated when creating the PRTG integration in AlertOps.
- Network connectivity from the PRTG core server to the AlertOps inbound integration endpoint.
- PRTG version 20.1.57 or later to use the
%laststatusnotification placeholder. For other versions, you could use%status
Configuration Steps
Part A: In AlertOps - Generate the Inbound Webhook URL
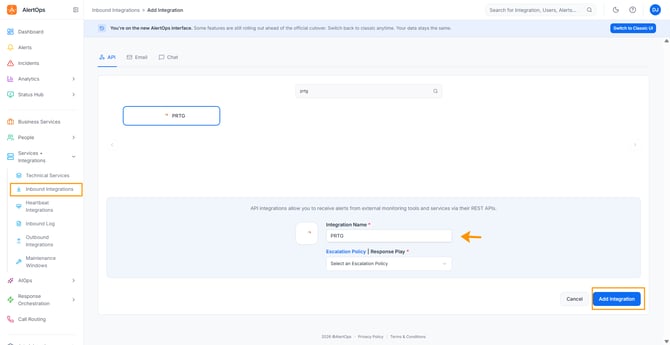
- In AlertOps, navigate to Services+Integrations → Inbound Integrations.
- Use the search bar to search for PRTG and select the integration template.
- Enter an integration name, then click Add Integration.
- Select an Escalation Rule to determine the escalation policy for incoming alerts.
- In the Who section, enter the names of the recipient group(s) and recipient user(s) who should receive the alerts.
- Click Save.
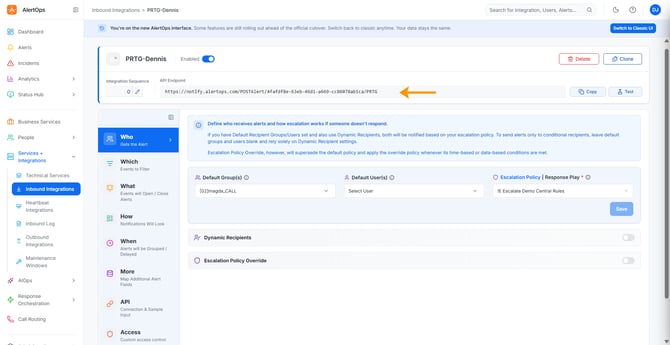
- Click Copy URL at the top of the integration form to copy the unique inbound webhook URL. You will need this URL when configuring PRTG.
Keep this URL available for the next part of the setup. It is the endpoint to which Alerta sends alert notifications.
Part B: In PRTG — Configure PRTG to Send Alerts to AlertOps
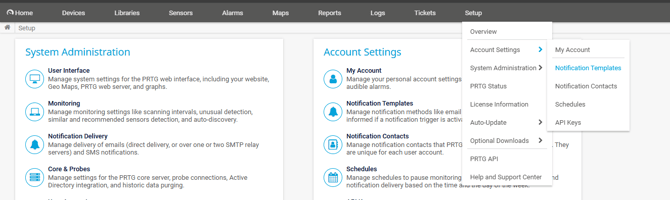
Step 1: In the PRTG Network Monitor menu option Select Setup -> Account Settings -> Notification Templates
Step 2: Select Add Notification Template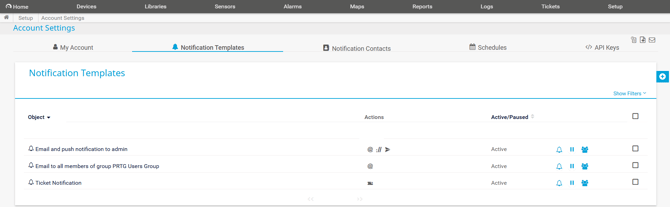
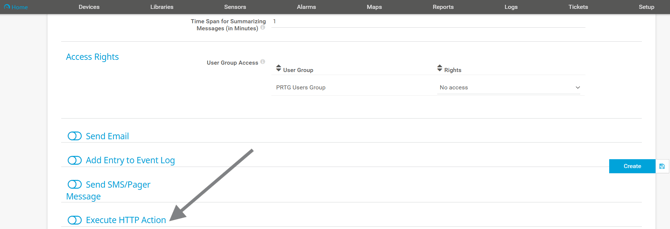
Step 3: Select “Execute HTTP Action”
Step 4: Configure your HTTP Action with your AlertOps Integration Endpoint URL and the HTTP Method as POST.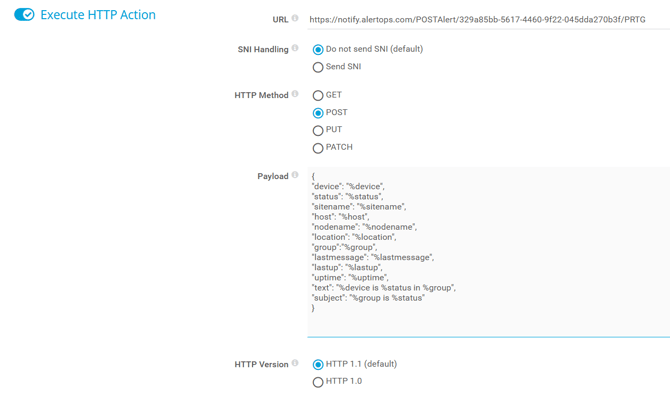
For the Notification Summarization, select "Always notify ASAP never summarize".
Step 5: Configure Notification Payload with the payload below:
device=%device&sensor=%sensor&sensorid=%sensorid&status=%laststatus&sitename=%sitename&host=%host&nodename=%nodename&location=%location&group=%group&lastmessage=%lastmessage&lastup=%lastup&uptime=%uptime&text=%device+%sensor+is+%laststatus+in+%group&subject=%sensor+is+%laststatus
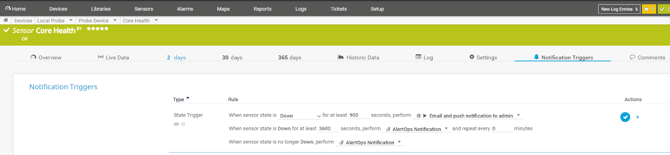
Step 6: Define triggers for group or device using the notification you created above.
Key Data Fields Required for Mapping
| AlertOps Alert Field |
PRTG Source Field |
Purpose and behaviour |
| Alert Source ID | sensorid |
Uniquely identifies the PRTG sensor. Allows AlertOps to correlate repeated notifications and match recovery events to the corresponding incident. |
| Source Status | status (%laststatus) |
Determines whether to open or close the corresponding AlertOps incident. Down opens an incident, while Up closes it. |
| Source Name | sitename |
Identifies the PRTG monitoring instance generating the notification. |
| Source URL | sensorurl (%linksensor) |
Provides a direct link to the affected sensor in the PRTG interface. |
| Subject | subject |
Identifies the affected sensor and its current status. |
| Email / Push Notification / SMS/Voice Notification | text |
Provides a human-readable summary containing the affected device, current sensor status, and group information. |
Formdata Payload to Use Inside AlertOps Integration
The AlertOps plugin generates the Formdata payload automatically. The following example reflects the actual payload structure used by the plugin.
Please navigate to the API Access and check if the Content Type is set to "Form Data"
device=%device&sensor=%sensor&sensorid=%sensorid&status=%laststatus&sitename=%sitename&host=%host&nodename=%nodename&location=%location&group=%group&lastmessage=%lastmessage&lastup=%lastup&uptime=%uptime&text=%device+%sensor+is+%laststatus+in+%group&subject=%sensor+is+%laststatus
How to Test the Integration
- In PRTG, select a suitable test sensor or monitored device.
- Trigger an actual sensor status change to
Down. - In AlertOps, navigate to Services+Integrations → Inbound Log.
- Locate the incoming PRTG message and inspect the received payload.
- Verify that the message is successfully mapped and that an AlertOps incident is created and routed according to the configured escalation rule and recipients.
- Restore the monitored sensor to the
Upstatus. - Verify that PRTG sends the recovery notification to AlertOps.
- Confirm that the corresponding AlertOps incident is automatically closed.
Testing tip: PRTG's Send Test Notification feature does not resolve notification placeholders. It sends the original placeholder variables instead. Therefore, use an actual sensor status change to validate the integration and verify that the placeholders are replaced correctly.
Troubleshooting tip:
-
If a message appears in the Inbound Log but no incident is created or closed, inspect the received payload and mapping status. Verify that the
statusfield contains the expectedDownorUpvalue and that thesensoridis consistent across both notifications. -
If the message appears in the Inbound Log but no incident is created, inspect the mapping status and payload. A successfully received message does not necessarily mean an incident was created. You can refer to this article: Inbound Log - Mapping Status.